Blog · 2026-06-24 · By Logan E Adams, Founder · 4 min read
We asked 5 AI engines for the best observability tool. They disagreed.
The short version: ask five different AI assistants for the best observability tool and you can get five different shortlists. In our measured data, no single vendor leads across every engine — so "are we recommended by AI?" has no single answer. It depends on which assistant your buyer happens to open, and on the third-party pages that assistant trusts. Here's the data, why it happens, and what to do about it.
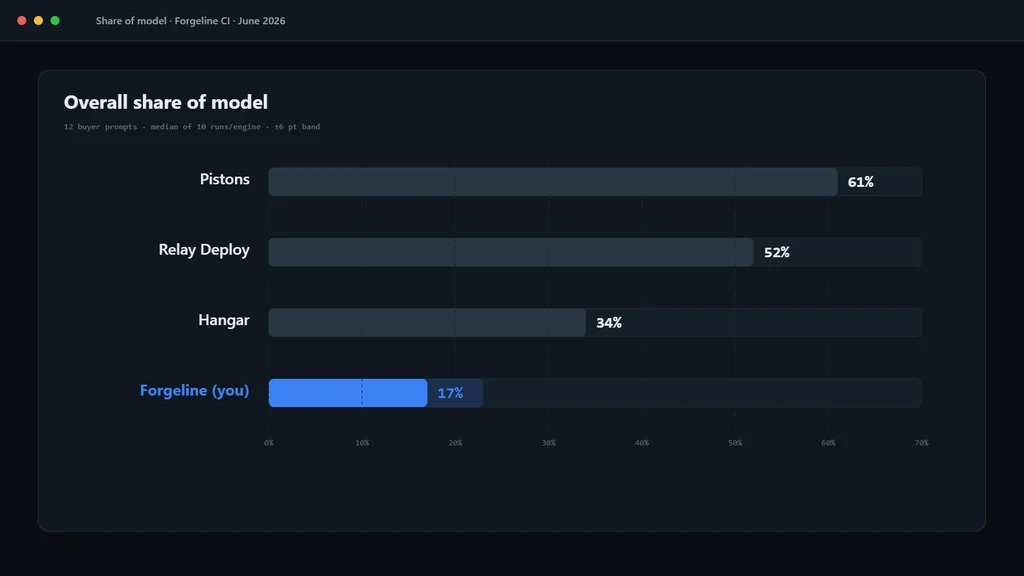
The method: measure it like a statistic, not a screenshot
We ran the same set of real buyer prompts — "best observability tool for a Series A startup," "Datadog alternative for a small team," and similar — against five AI engines: ChatGPT, Perplexity, Gemini, Claude, and Grok. Each prompt was repeated 10 or more times per engine, because a single AI answer is one draw from a distribution, not a fact. (We wrote a whole piece on why a single screenshot isn't proof.)
For every answer we recorded which vendors were named and which sources were cited, then computed each vendor's share of model — the percentage of all recommendations that name them — with a Wilson 95% confidence interval over the pooled mention denominator, so the ranking carries its own uncertainty rather than pretending to be exact. (Presence figures — whether you appear or get cited at all — carry a Wilson 95% interval too.) The full, public methodology and the live leaderboards live in our AI Visibility Index.
What we found: the leader changes with the engine
No single vendor led on all five engines. A name that dominated one assistant was frequently mid-pack — or absent — on another. You can see this for yourself on the live observability leaderboard: the order shifts depending on which engine you weight.
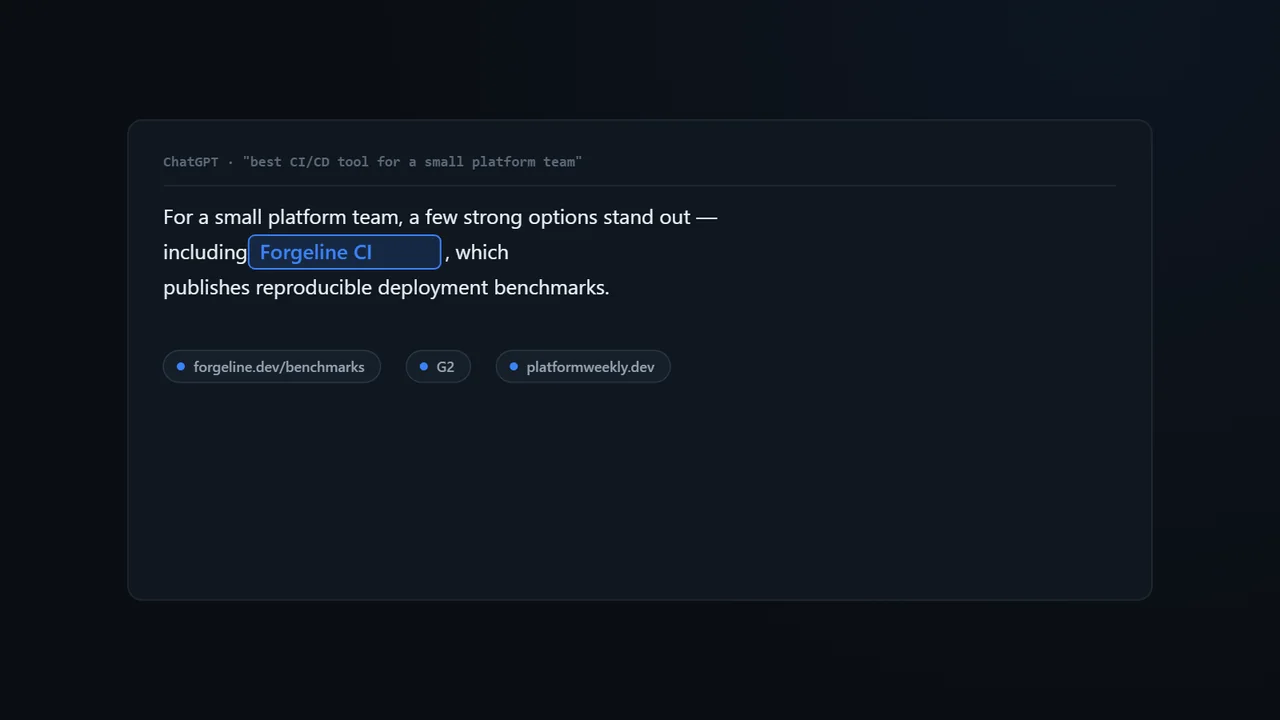
Two patterns showed up again and again:
- Per-engine spread. A single vendor's appearance rate can swing by tens of percentage points between its strongest and weakest engine. Being strong on Perplexity tells you very little about how you do on Gemini.
- Citation-driven, not marketing-driven. Roughly 95% of the citations behind these answers came from third-party pages — comparison posts, review sites like G2, documentation, and community threads — not the vendors' own marketing pages (Otterly). The engines are summarising what other people say about you.
A worked example
Picture two observability vendors, A and B. On Perplexity, A appears in most answers because a popular "best observability tools" listicle ranks it first and Perplexity leans heavily on that page. On Gemini, B wins the same prompt because Gemini surfaces a Reddit thread and a vendor-neutral comparison where B is the community favourite. Same question, same week — opposite shortlists. Neither vendor changed anything; the sources each engine trusts differ.
If A only ever checked Perplexity, it would conclude it is winning AI search. It isn't — it's winning one engine, and quietly losing the buyers who open a different one.
Why this should worry — or excite — you
If your visibility is strong on one engine and invisible on another, you are losing shortlist spots you will never see in your web analytics, because the buyer never clicked through to be counted. That's the worrying part.
The exciting part: the inputs are knowable. Which third-party pages each engine cites, how consistent your entity and structured data are, whether you appear in the comparisons and communities the models read — all of it is measurable and workable. And it moves: the set of sources AI cites is not static — a substantial share changes from one month to the next (Profound) — so the leaderboard is contestable rather than locked.
What to do about it
1. Measure per engine, not in aggregate. An average hides the engine where you're invisible. Track share of model on each assistant your buyers actually use, with a confidence interval, so you can tell signal from noise. 2. Win the sources, not just the homepage. Because the citations are overwhelmingly third-party, the work is earning a place in the comparison pages, review profiles, and threads each engine pulls from — that's what AEO actually is, and how it differs from classic SEO. 3. Re-measure on a cadence. The leaderboard drifts as the models and their sources change; a number from last quarter may already be stale.
FAQ
Why do AI engines disagree if they read the same internet? They don't read the same internet at answer time. Each assistant retrieves and weights a different set of sources, and some lean on their own index or content partners. Different inputs produce different shortlists.
Is "share of model" the same as a ranking? It's the measurement behind a ranking — the percentage of recommendations that name you, with a confidence interval, per engine. A leaderboard is simply share of model, sorted.
Can I just optimise for ChatGPT since it's the biggest? Only if all of your buyers use ChatGPT. Most categories see real usage across all five engines we measure, and the leader differs on each — so single-engine optimisation leaves shortlist spots on the table. See our comparison of the engines for where each one pulls from.
See where you stand
Start by measuring your own share of model across every engine your buyers use. Get a free AI-visibility teardown and we'll show you exactly where you lead, where you're invisible, and which sources to win — reproducibly, not from a single screenshot.
Last updated: 2026-06-24 (published 2026-06-24). We re-check figures on a cadence because AI engines change continuously.
AI-accelerated, human-reviewed. Every number and claim verified before publishing. How we make our content →

Logan E Adams · Founder, Clear Cited
Built Clear Cited’s reproducible AEO measurement methodology (adaptive per-engine sampling with a 5-run floor; presence carries a Wilson 95% CI; share-of-model a percentile bootstrap 95% CI in the paid audit and a Wilson 95% CI in the public Index) and its open-source tooling. Measurement-first, no hype.
Comments
No comments yet — be the first, below.